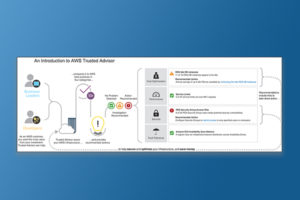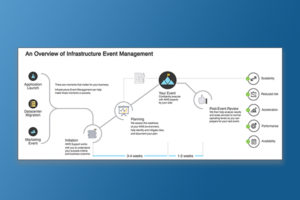
Amazon Web Services highlights valuable program features with infographics
See how Cadence Preferred surfaces the value proposition of little-known Amazon programs
When you’re immersed in the details of a specific program daily, it’s easy to lose track of the fact that your audience is not. Amazon Web Services had this in mind when they built pages for two of their premium services: Trusted Advisor and Infrastructure Event Management.
They had plenty of detail – page after page of text – explaining key concepts about how to get the best value from AWS infrastructure. Yet they pondered how to best present and organize the information so customers could walk away informed and satisfied. That’s when AWS brought in Cadence Preferred to develop infographics that would surface the value and benefits of these services.
Learning more about AWS
To put the ‘info’ in ‘infographic,’ our team needed to become more familiar with what these services could do for AWS customers. The best method for accomplishing that was to speak with people who lived and breathed Amazon Web Services. We interviewed subject matter experts and marketers to learn more about Trusted Advisor and Infrastructure Event Management. Afterwards, we researched existing documentation in order to best visualize the typical customer journey.


Designing and developing the infographics
We had a handle on the benefits of Trusted Advisor and Infrastructure Event Management. Thus, it was time for us to design the infographics. Our goal was to include the most pivotal points and enable website visitors to understand these services at a glance.
Furthermore, our joint goal was high-level information sharing. We wanted to combine light copy and graphics to communicate the processes and outcomes of these services. Interested customers would have enough of an understanding to dive deeper into the details. They could ultimately benefit from the rich content currently published on the site.


